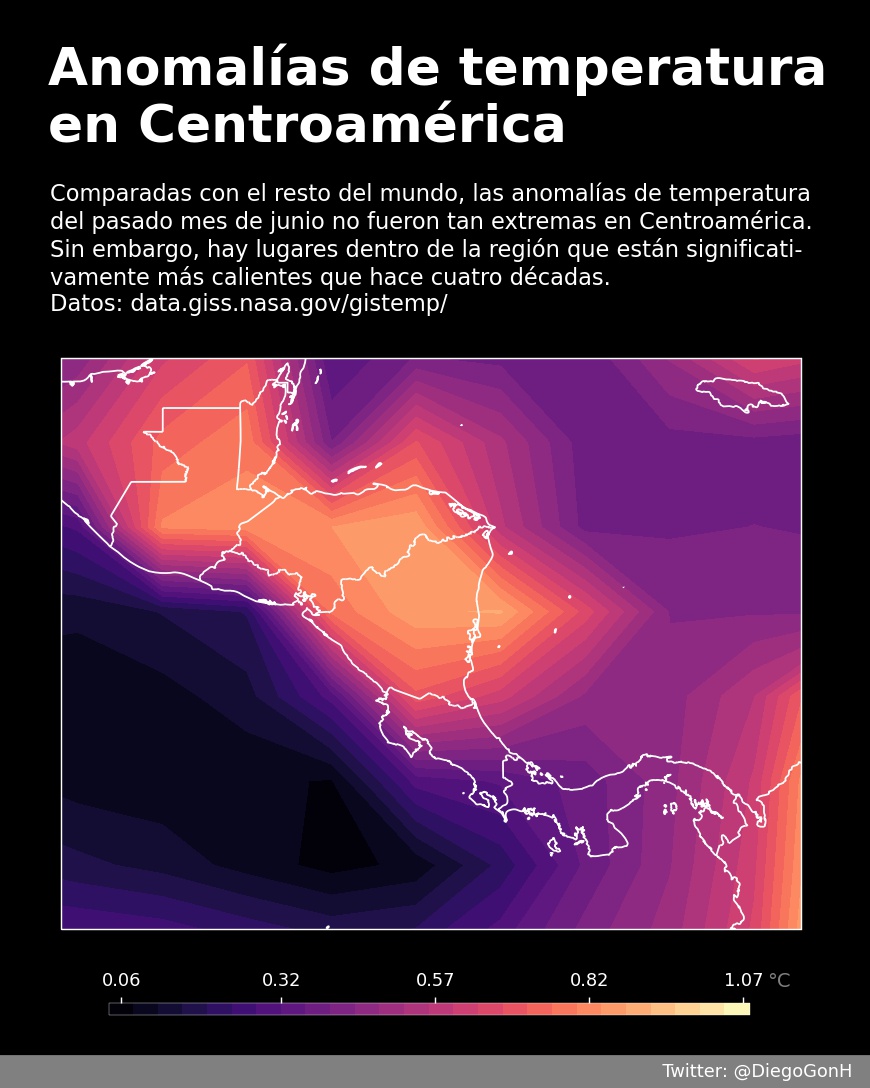
Temperature anomalies in Central America
This image shows the temperature anomalies in Central America during June 2021. As we can appreciate, some areas in the region are almost 1°C warmer than compared to the baseline (1951-1980).
Learn moreDuring one biology lecture in high school, my teacher stopped to told us how fascinating our world is. That everything works in a marvelous harmony. He then told us that every time that a human is born, our planet expels a small part of its atmosphere to keep a constant pressure. I was completely perplexed. My scientific literacy at the time was pretty lacking, but I knew enough to recognize that what he was saying was incorrect. The problem was that my teacher was not joking. He truly believed what he was saying. Unfortunately, this type of comments are not uncommon in my country, which has made me truly recognize the lack of scientific progress in Guatemala and most of Latin America.
Given the lack of educational infrastructure in Guatemala, curious students have to constantly rely on sources outside of their classrooms. A magnificent source of seemingly endless educational materials is the internet. However, most good-quality resources are not written in my native language, which is a challenge I myself had to overcome. This challenge only worsens the already huge barrier that people from developing countries must face when they desire to become scientists.
Motivated by this, I've decided to do a conscious effort to bring science to a wider audience, especially in Spanish. Currently, I spend some of my time sharing scientific data visualizations and making presentations.
Visualizations are extremely important for scientific communication. Thus, I like to create and share graphs using data related to different topics (however, I've mostly focused on climate change). To be completely transparent, I also maintain a public GitHub repository where I keep all the scripts I’ve used to create the graphs. Here are some visualizations I’ve done:
This image shows the temperature anomalies in Central America during June 2021. As we can appreciate, some areas in the region are almost 1°C warmer than compared to the baseline (1951-1980).
Learn more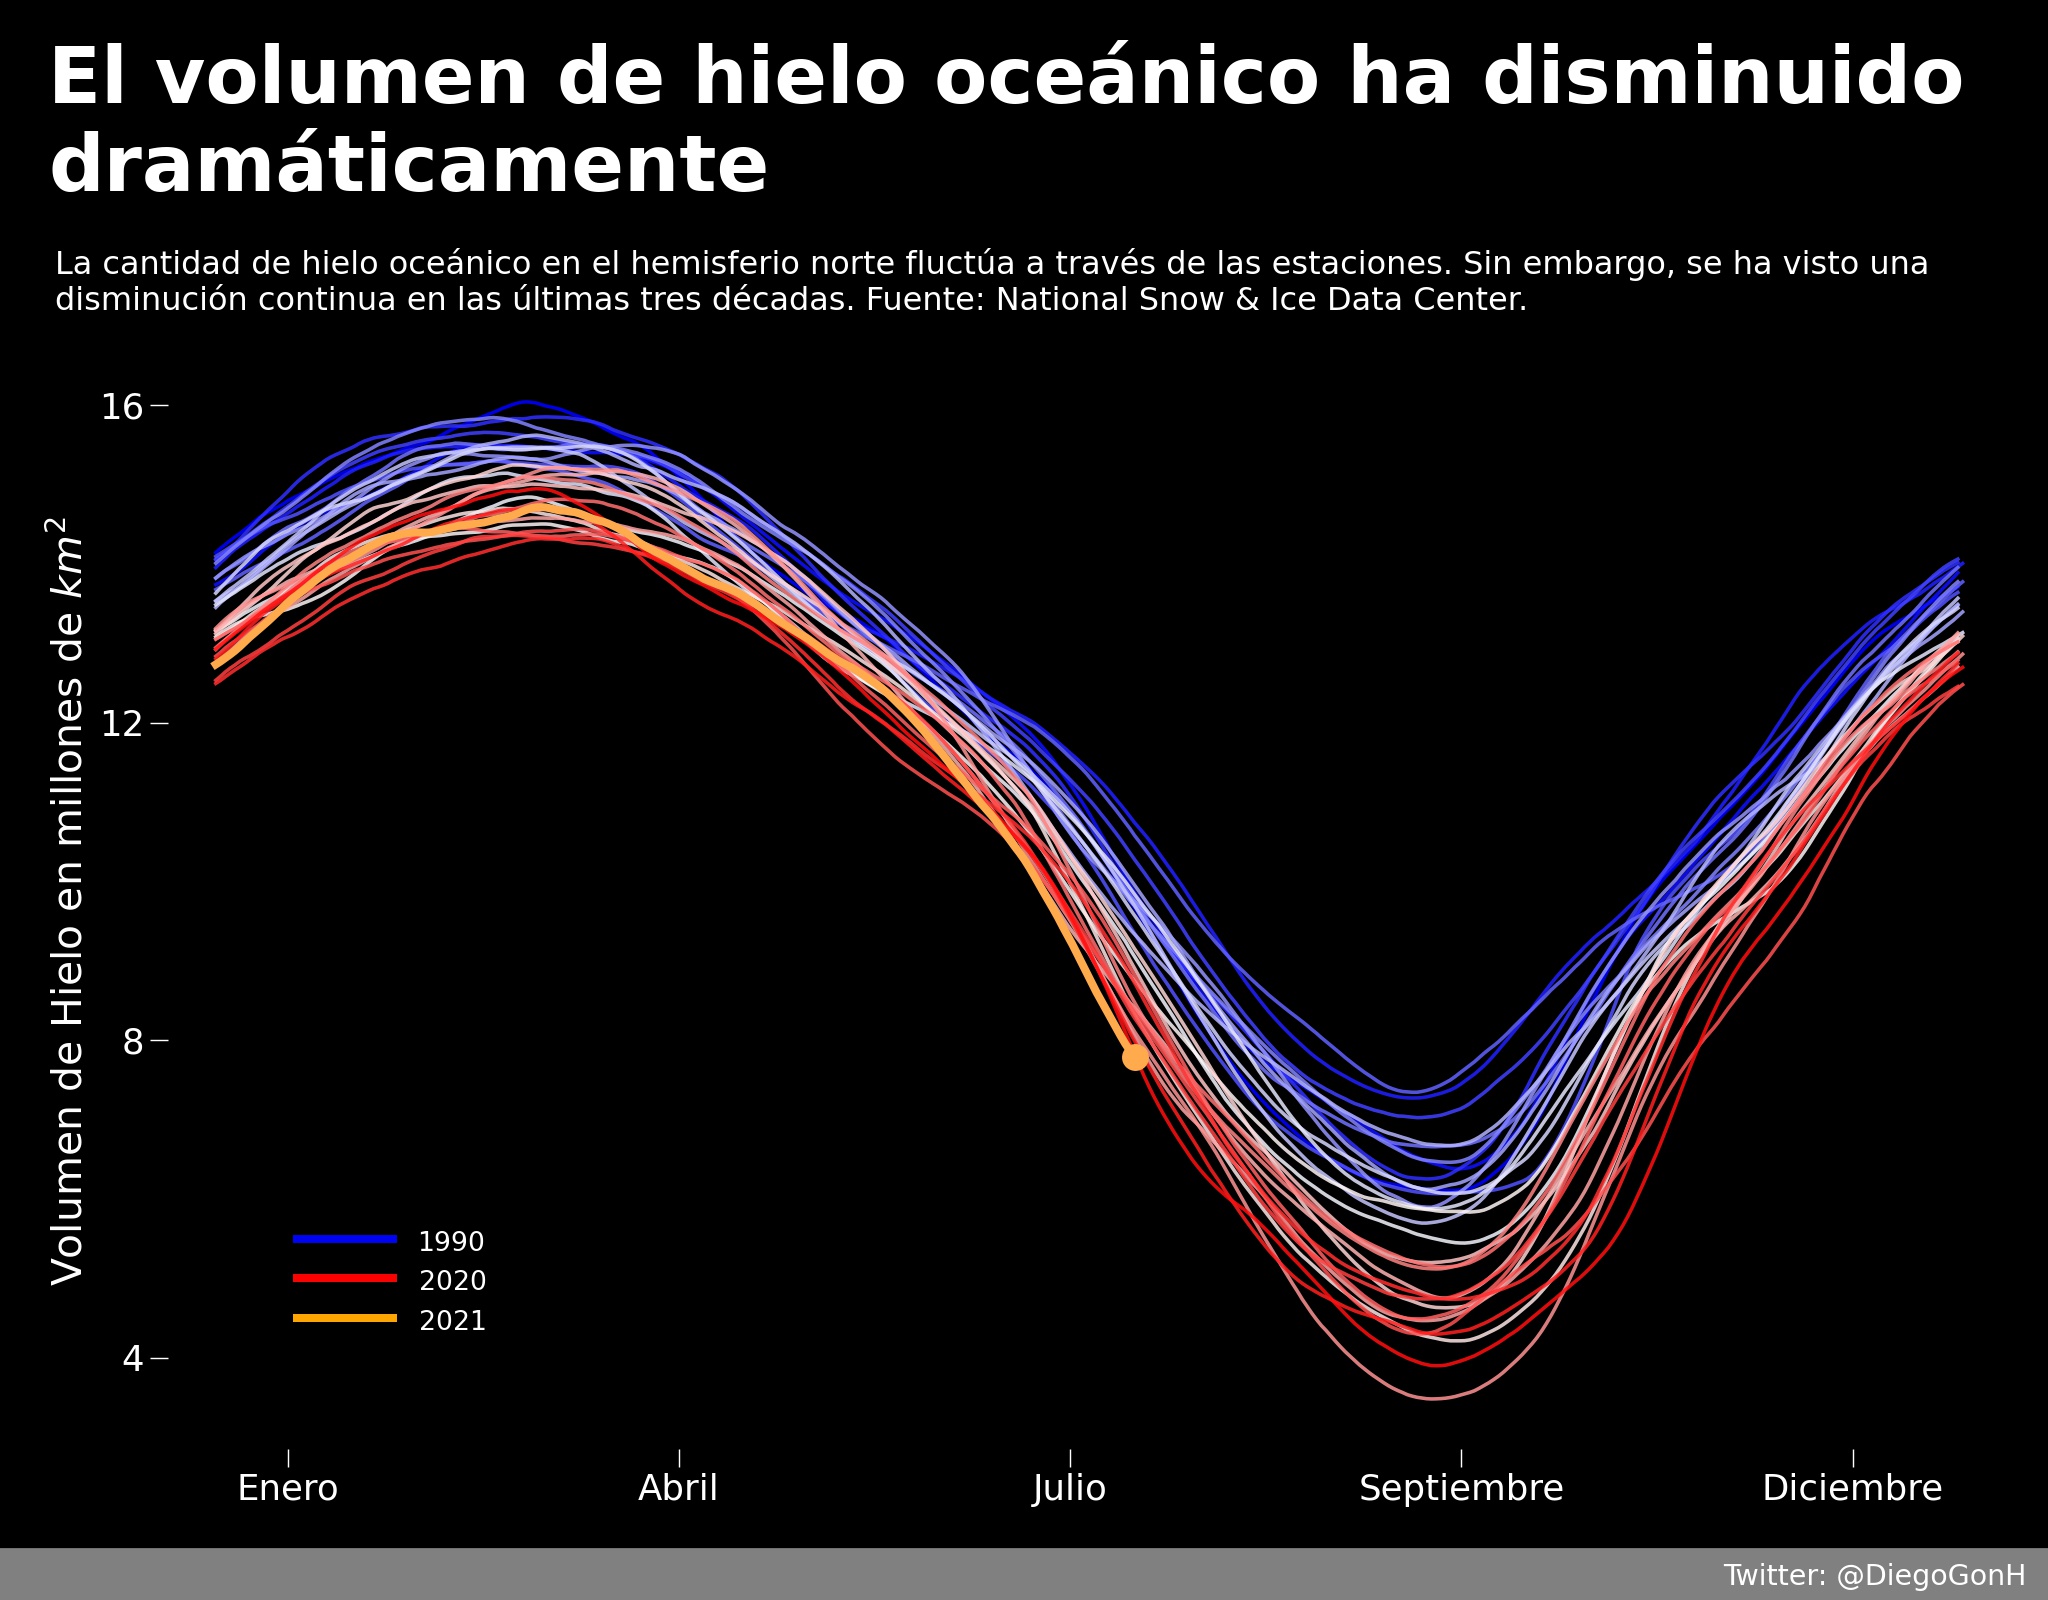
One of the most evident effects of global warming is the melting of the polar ice caps. This graph shows how the sea ice extent has been decreasing in the Northern Hemisphere over the past four decades.
Learn moreWhenever I have the opportunity, I like to give public lectures about various topics in astrophysics, specially if the lecture is in my home country.

A talk about artificial intelligences and their applications in astronomy, including two demos (classification of galaxies and stars, and prediction of solar flares). Presented to the Guatemalan Association of Astronomy on January 2021.
Learn more
A talk about Young Stellar Objects with an overview of their circumstellar structures. Presented to the Guatemalan Association of Astronomy on August 2021.
Learn more